

Schedule Listing
This is the list of scheduled publications that will be rendered when specified.
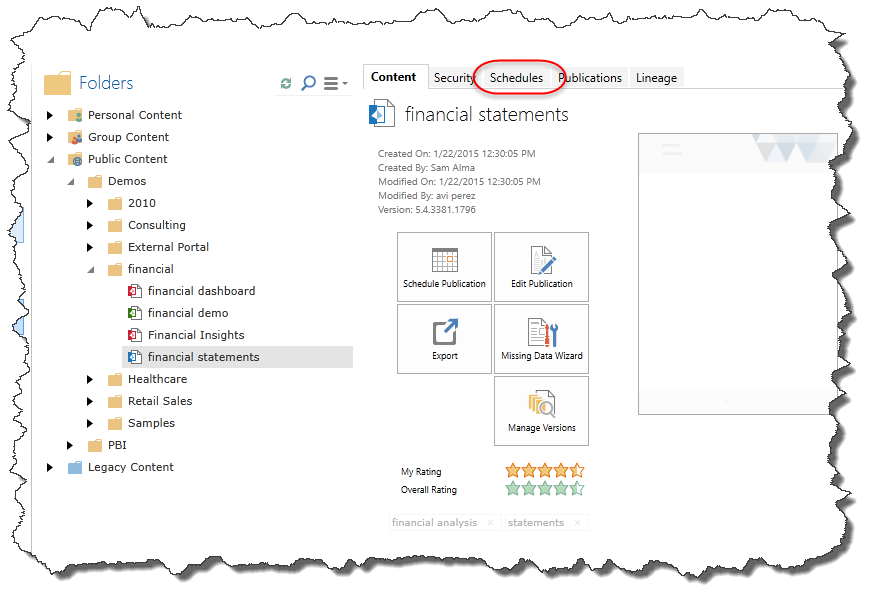
Accessing the Schedule Listing
Through the backstage in the main client you can find the Schedule Listing on the Open page. You can click on the "Schedules" tab (outlined in red) to get the Schedule Listing.
Managing the Schedule Listing
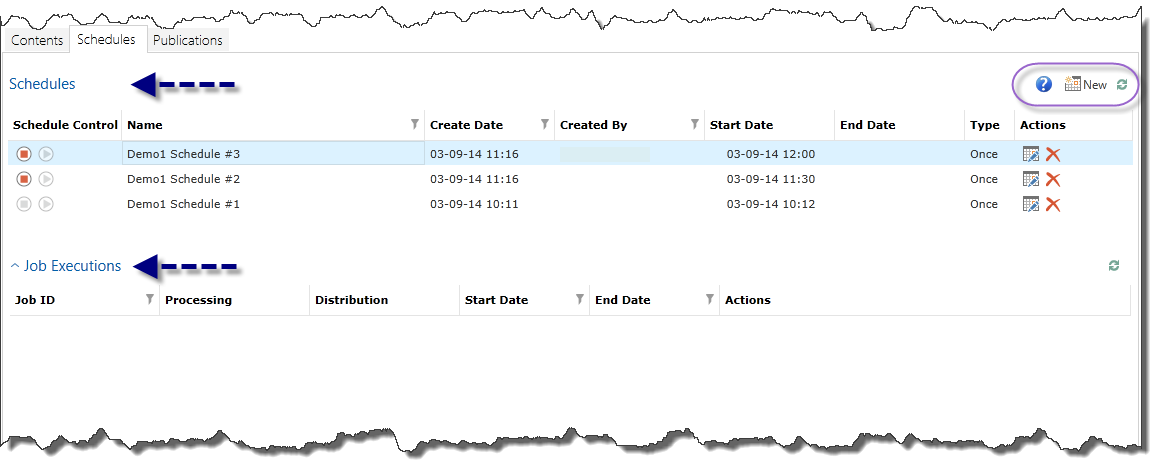
There is a quick menu on the right-hand side (outlined in purple):
- Help icon – this will take you to the Help Guide
- New – will take you to the Schedule Interface to schedule a publication to be rendered in specified circumstances.
- Refresh icon – will refresh all the data in case of additions or modifications to the schedule listing.
There are two main sections in the workspace (indicated by the blue arrow):
Metadata Section
- There are two buttons: “stop” or “play”. If the Schedule has already rendered the publication, then you cannot “stop” it. However, if the scheduled item is in the middle of execution, you can “stop” it. This will pause all production activity on the schedule, its associated jobs and publications.
- "Inactive": This appears when there are changes to the original template’s Slicer Manager. You can reactivate the scheduled item by editing it.
Name – this is the name of the scheduled item.
Create Date – this when you created the scheduled item.
Created by – the name of the user who created the scheduled item.
Start Date – this is the date and time that the scheduled item was first scheduled to run.
End Date – this is the date and time for the last scheduled run.
NOTE: If you created the scheduled item to “Run once”, there is no End Date.
Type – this is how often you have scheduled the scheduled item: Once, Hourly, Daily, Weekly, Monthly
Actions – you can edit or delete the scheduled item.
NOTE: The delete only removes the listing from the current interface. It can still be found in the administrative console.
Job Execution Section:
This is the list of jobs (“executions”) of the selected scheduled item from the section above.
(You need to click the arrow (outlined in red) to pull up this list.)
NOTE: This list will auto-refresh every five seconds.
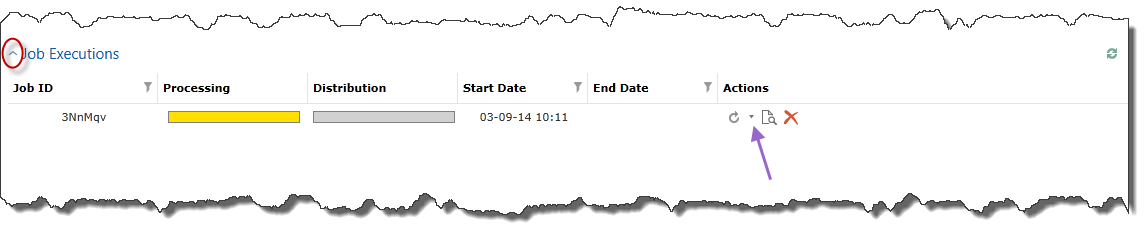
Job ID – The unique name of the execution
Processing – this is the progress bar to indicate the status of the execution of scheduled item. If you hover your cursor over the progress bar, you can see the specifics of the status.
| Color | Status |
|---|---|
| Blue | Unprocessed |
| Green |
Successful execution |
| Yellow | In process |
|
Orange |
Partially successful execution |
| Red |
Execution errors |
Distribution – this is the progress bar to indicate the status of the sent emails of the rendered publications. If you hover your cursor over the progress bar, you can see the specifics of the status. It is possible that some of the publications were processed successfully, while other publications did not. The bar is color-coded:
| Color | Status |
|---|---|
| Green | Successful execution |
| Yellow |
In progress |
|
Orange |
Waiting |
| Red |
Execution errors |
Start Date – this is when the execution began
End Date – this is when the execution ended
Actions – these are the actions you can run on the executed jobs:
Rerun icon – You can click on the arrow (indicated with the purple arrow) to access the re-run drop-down menu. You can choose to:
- Rerun that entire execution which are all the publications.
- Rerun publications with errors.
- Publications that were partially successful.
- Publications that succeeded.
View Output – When you click on this icon, you will be taken into the Publication Listing.
Delete – You can delete the executed job.
Home |
Table of Contents |
Index |
User Community
Pyramid Analytics © 2011-2022